blackbox monitoring은 증상이 발생한 부분을 확인하며, 예측되지 않은 활성 문제를 모니터링
blackbox monitoring을 통해 시스템이 제대로 작동하지 않음을 확인 한 이후에 whiteblox monitoring의 계측을 통해 로그 또는 HTTP 엔드 포인트와 같은 시스템 내부를 검사하는 기능
blackbox monitoring은 외부에서 시스템 상태를 확인(예 : 서버가 200 개의 HTTP 코드로 응답)
whiteblox monitoring은 내부 메트릭과 로그를 사용하여 시스템 문제를 표면화
blackbox monitoring과 whiteblox monitoring의 차이
모니터링은 어떤 방법을 체택하는지에 따라 크게 writebox monitoring과 blackbox monitoring으로 구분
1. whitebox monitoring
에이전트 혹은 소프트웨어를 설치해서 모니터링
Zabbix, PRTG, Prometheus 등이 whitebox monitoring에 속함 → 일반적인 모니터링 기술들
whitebox monitoring은 접근성은 좋으나 실제 모니터링 시스템을 구축할 때 모니터링 "소스(source)"가 되는 기술에 대한 이해도가 높아야함
2. blackbox monitoring
시스템 내부가 어떻게 동작하는지보다 관측 가능한 행위에 초점을 두는 모니터링
CPU가 어떻게 동작하는지, Memory가 어떻게 동작하는지 몰라도 됨 → CPU 사용량이 얼마인지, Memory 사용량이 얼마인지가 중요
TCP가 어떻게 동작하는지 알 필요 X → 실행되는 프로세스에 TCP 연결이 가능한지 여부가 중요
모니터링하려고 하는 내용의 동작 원리를 알지 못하여도 문제되지 않음
blackbox monitoring 쪽에서 유명한 기술은 Nagios
3. Prometheus는 whitebox monitoring과 blackbox monitoring 둘다 가능
Prometheus는 기본적으로 whitebox monitoring에 속하지만, 프로메테우스 재단은 Prometheus로 blackbox monitoring을 지원하기 위해서, 공식적으로 blackbox-exporter를 지원
blackbox-exporter는 HTTP, HTTPS는 물론 TCP, ICMP, DNS 등의 프로토콜 위에서 동작하는 엔드포인트들에 대한 blackbox monitoring을 가능하게 해줌
Prometheus쪽에서 해당 IP:PORT 정보를 제공해야만 모니터링 가능
blackbox-exporter와 설치
1. 서버 환경에서는 blackbox-exporter 스크립트 명령어 설치 및 구동
# 현재 디렉토리 위치$ pwd
/root
# blackbox-exporter를 설치할 디렉토리 생성$ mkdir black
# 디렉토리 이동$ cd black
# 최신 버전 blackbox-exporter 설치$ wget https://github.com/prometheus/blackbox_exporter/releases/download/v0.18.0/blackbox_exporter-0.18.0.linux-amd64.tar.gz
# 압축 파일 해제$ tar zxvf blackbox_exporter-0.18.0.linux-amd64.tar.gz
blackbox_exporter-0.18.0.linux-amd64/
blackbox_exporter-0.18.0.linux-amd64/blackbox_exporter
blackbox_exporter-0.18.0.linux-amd64/LICENSE
blackbox_exporter-0.18.0.linux-amd64/blackbox.yml
blackbox_exporter-0.18.0.linux-amd64/NOTICE
# 압축해제된 디렉토리에 접근$ cd blackbox_exporter-0.18.0.linux-amd64/
# blackbox-exporter 실행$ ./blackbox_exporter
2. blackbox.yml 설정 파일을 토대로 blackbox-exporter 스크립트 실행
# <blackbox_exporter 경로> --config.file=<blackbox_exporter 설정 파일 경로>
$ ./blackbox_exporter --config.file=./blackbox.yml
3. blackbox-exporter 서비스로 실행 → blackbox-exporter 명령어를 systemd로 관리
$pwd
/root/black/blackbox_exporter-0.18.0.linux-amd64/
# user 추가$ useradd --no-create-home --shell /bin/false blackbox_exporter
# 생성한 blackbox_exporter 계정 확인$ cat /etc/passwd | grep blackbox_exporter
blackbox_exporter:x:1004:1004::/home/blackbox_exporter:/bin/false
# 실행 파일 및 설정 파일 /usr/local/bin/으로 경로 이동$ cp ./blackbox_exporter /usr/local/bin$ cp ./blackbox.yml /usr/local/bin
# /usr/local/bin/blackbox_exporter blackbox_exporter 유저, 그룹 권한 주기$ chown blackbox_exporter:blackbox_exporter /usr/local/bin/blackbox_exporter
# 명령어 복사 및 사용 권환 변경 확인$ ls -al /usr/local/bin/blackbox_exporter
-rwxr-xr-x 1 blackbox_exporter blackbox_exporter 18264924 Nov 22 17:34 /usr/local/bin/blackbox_exporter
# 서비스 파일 등록$ cat << EOF | tee /etc/systemd/system/blackbox_exporter.service
[Unit]
Description=Blackbox Exporter
Wants=network-online.target
After=network-online.target
[Service]
User=blackbox_exporter
Group=blackbox_exporter
Type=simple
ExecStart=/usr/local/bin/blackbox_exporter --config.file=/usr/local/bin/blackbox.yml
[Install]
WantedBy=multi-user.target
EOF
# 데몬 리로드$ systemctl daemon-reload
# 서비스 구동$ systemctl restart blackbox_exporter
# 서비스 상태 확인$ systemctl status blackbox_exporter
● blackbox_exporter.service - Blackbox Exporter
Loaded: loaded (/etc/systemd/system/blackbox_exporter.service; disabled; vendor preset: disabled)
Active: active (running) since Mon 2021-11-22 17:35:28 KST; 4s ago
Main PID: 6615 (blackbox_export)
Tasks: 7
Memory: 2.2M
CGroup: /system.slice/blackbox_exporter.service
└─6615 /usr/local/bin/blackbox_exporter --config.file=/usr/local/bin/blackbox.yml
4. blackbox-exporter 설정
blackbox-exporter가 Prometheus가 설정한 IP:PORT에서 TCP 통신이 가능한지 여부에 대한 메트릭을 수집하게 하려면 설정 파일에서 모듈 생성 필요
$systemctlrestartblackbox_exporter# 서비스 상태 확인$systemctlstatusblackbox_exporter●blackbox_exporter.service-BlackboxExporterLoaded:loaded(/etc/systemd/system/blackbox_exporter.service;disabled;vendor preset:disabled)Active:active(running)sinceMon2021-11-22 17:37:32 KST;5sagoMain PID:8674(blackbox_export)Tasks:8Memory:2.1MCGroup:/system.slice/blackbox_exporter.service└─8674/usr/local/bin/blackbox_exporter--config.file=/usr/local/bin/blackbox.yml
Prometheus에서 blackbox-exporter 연동
Prometheus에서 blackbox-exporter가 수집하고 있는 메트릭을 스크래이핑
relabel_configs는 설정 파일 형식 토대로 생성 → replacement는 "<blackbox 설치된 인스턴스 IP:9115>"
$vi/etc/prometheus/prometheus.yml# my global configglobal:scrape_interval:15s# By default, scrape targets every 15 seconds.evaluation_interval:15s# By default, scrape targets every 15 seconds.external_labels:monitor:'kubernetes-monitoring'# prometheus에 blackbox-exporter를 추가-job_name:'blackbox-exporter'scrape_interval:5smetrics_path:/probeparams:module: [tcp_connect]
static_configs:-targets:- [모니터링서버IP]:80relabel_configs:-source_labels: [__address__]
target_label:__param_target-source_labels: [__param_target]
target_label:instance-target_label:__address__replacement: [blackbox설치된인스턴스IP]:9115
Prometheus 재구동
# Prometheus 서비스 재시작$ systemctl restart prometheus
# prometheus 서비스 상태 확인$ systemctl status prometheus
Prometheus UI에서 쿼리를 입력 → blackbox-exporter 설치한 서버의 값 읽음 (probe_success)
probe_success가 blackbox-exporter가 지정한 프로토콜 방식으로 IP:PORT와 연결이 성공했음을 알리는 지표
blackbox 서버 모니터링을 위한 Grafana 대시보드 구축
Grafana로 대시보드를 구축할 때 정말 좋은 점은 black-exporter같이 많이 사용하는 Exporter에 대한 대시보드가 이미 공유됨 손쉽게 사용 가능
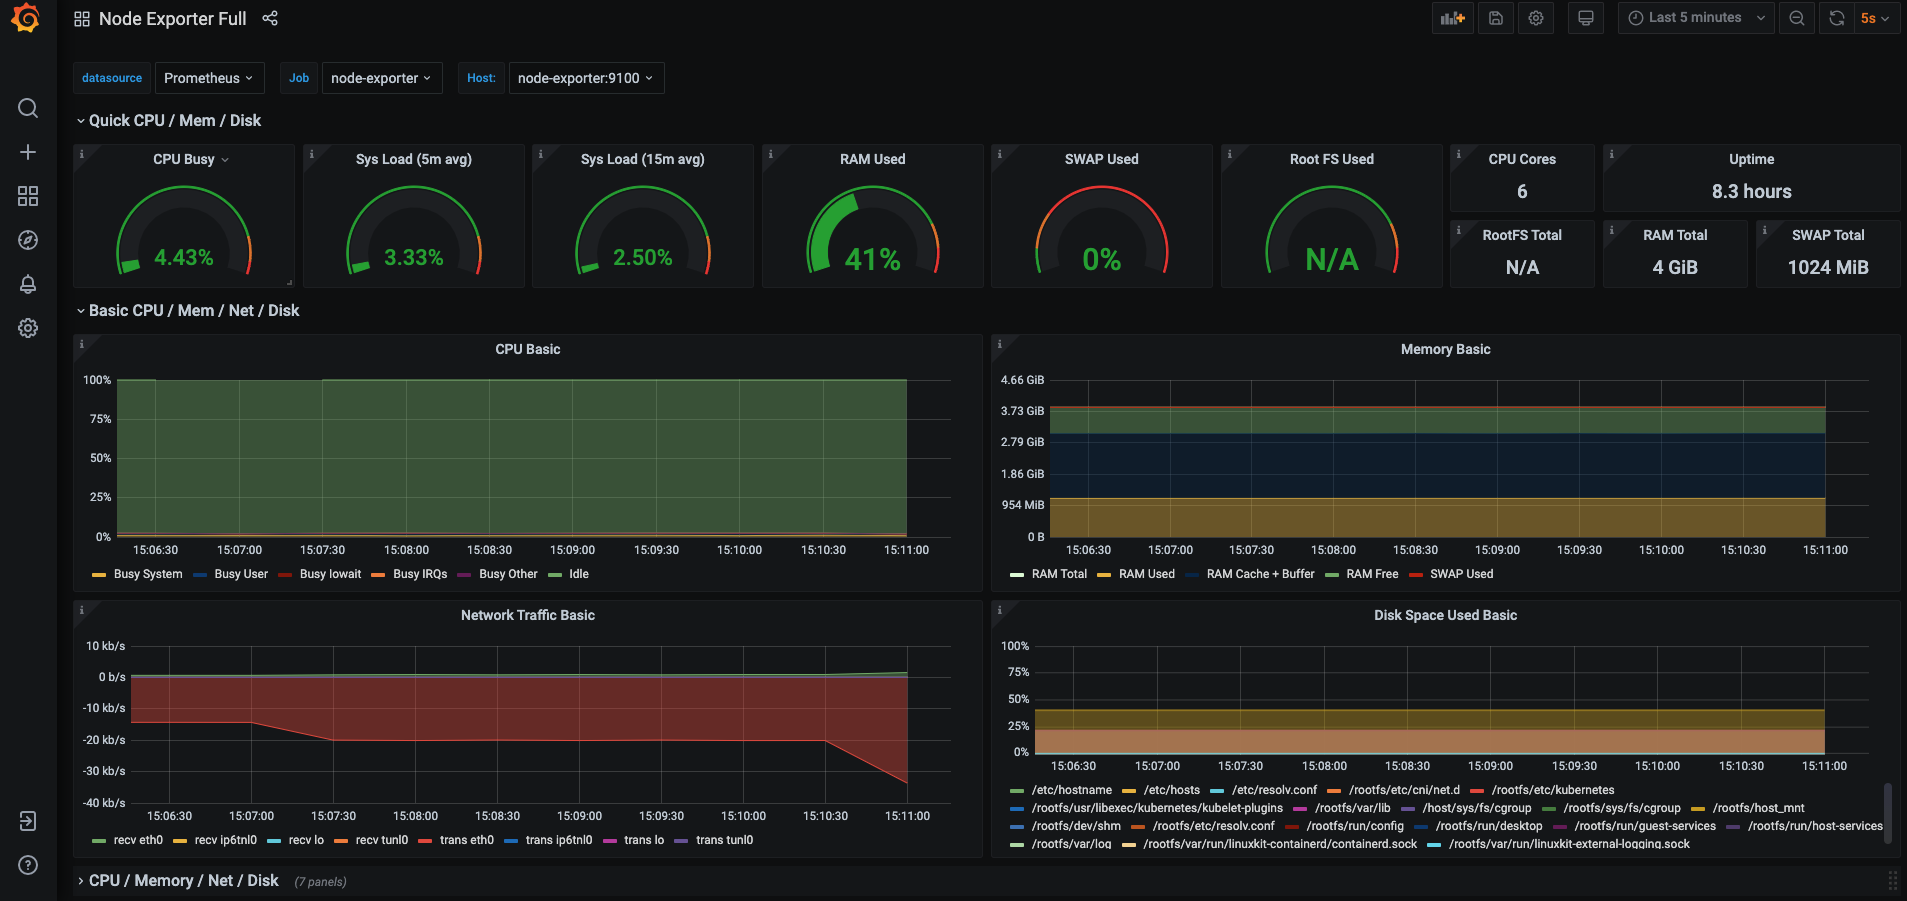
Grafana, Prometheus, node-exporter를 이용해서 시스템 메트릭을 모니터링할 수 있는 대시보드를 구축
Grafana, Prometheus, node-exporter 구성 인프라스트럭처
node-exporter란
UNIX 계열 커널을 가진 하드웨어와 OS 등 "시스템 메트릭"을 수집하는 Exporter
Prometheus 재단이 공식적으로 지원하고 있는 Exporter 중 하나
Prometheus로 모니터링 시스템을 구축 시 시스템 메트릭 수집을 위해 가장 우선적으로 고려되는 Exporter
node-exporter의 exporter의 의미
특정 메트릭을 수집해서 엔드포인트에 노출시키는 소프트웨어(software) 혹은 에이전트(agent)
node-exporter가 UNIX 계열 서버의 cpu, memory 등의 메트릭을 수집할 수 있는 것처럼, DB, 하드웨어, 메세지 시스템, 저장소 등 여러 시스템에 대한 익스포터가 존재
CollectD 등 기존의 서버 모니터링에 사용되는 에이전트들과 통합할 수 있는 익스포터도 존재
node-exporter 설치 (서버)
1. node-exporter 스크립트 명령어로 실행
# 현재 위치 확인$ pwd
/root
# 설치하는 컴포넌트들의 관리를 더 쉽게 하기 위해서 디렉토리 생성$ mkdir node
# 디렉토리 이동$ cd /root/node
# 압축 파일 다운로드$ wget https://github.com/prometheus/node_exporter/releases/download/v1.2.0/node_exporter-1.2.0.linux-amd64.tar.gz
# 설치한 node-exporter 바이너리 파일 확인$ ls
node_exporter-1.2.0.linux-amd64.tar.gz
# 압축 파일 해제$ tar zxvf node_exporter-1.2.0.linux-amd64.tar.gz
node_exporter-1.2.0.linux-amd64/
node_exporter-1.2.0.linux-amd64/LICENSE
node_exporter-1.2.0.linux-amd64/NOTICE
node_exporter-1.2.0.linux-amd64/node_exporter
# node_exporter 설치된 디렉토리로 이동$ cd /root/node/node_exporter-1.2.0.linux-amd64
# node_exporter 실행 → 포그라운드로 실행하면 다른 작업이 불가능함으로 백그라운드로 실행(& 붙임)$ ./node_exporter
2. node-exporter 서비스로 실행 → node-exporter 명령어를 systemd로 관리
# 현재 디렉토리 위치 확인$pwd
/root/node/node_exporter-1.2.0.linux-amd64
# user 추가$ useradd --no-create-home --shell /bin/false node_exporter
# 생성한 prometheus 계정 확인$ cat /etc/passwd | grep node_exporter
node_exporter:x:1001:1001::/home/node_exporter:/bin/false
# 실행 파일 /usr/local/bin/으로 경로 이동$ cp ./node_exporter /usr/local/bin
# /usr/local/bin/node_exporter node_exporter 유저, 그룹 권한 주기$ chown node_exporter:node_exporter /usr/local/bin/node_exporter
# 명령어 복사 및 사용 권환 변경 확인$ ls -al /usr/local/bin/node_exporter
-rwxr-xr-x 1 node_exporter node_exporter 18494531 Nov 20 14:37 /usr/local/bin/node_exporter
# 서비스 파일 등록$ cat << EOF | tee /etc/systemd/system/node_exporter.service
[Unit]
Description=Node Exporter
Wants=network-online.target
After=network-online.target
[Service]
User=node_exporter
Group=node_exporter
Type=simple
ExecStart=/usr/local/bin/node_exporter
[Install]
WantedBy=multi-user.target
EOF
# 데몬 리로드$ systemctl daemon-reload
# 서비스 가동$ systemctl restart node_exporter
# 서비스 상태 확인$ systemctl status node_exporter
● node_exporter.service - Node Exporter
Loaded: loaded (/etc/systemd/system/node_exporter.service; disabled; vendor preset: disabled)
Active: active (running) since Sat 2021-11-20 14:39:30 KST; 11s ago
Main PID: 19812 (node_exporter)
Tasks: 5
Memory: 8.4M
CGroup: /system.slice/node_exporter.service
└─19812 /usr/local/bin/node_exporter
[..생략..]
3. curl 명령어를 입력하여 node-exporter를 통해 수집되는 데이터가 있는지 확인
$ curl localhost:9100/metrics
# HELP go_gc_duration_seconds A summary of the pause duration of garbage collection cycles.# TYPE go_gc_duration_seconds summary
go_gc_duration_seconds{quantile="0"} 0
go_gc_duration_seconds{quantile="0.25"} 0
go_gc_duration_seconds{quantile="0.5"} 0
go_gc_duration_seconds{quantile="0.75"} 0
go_gc_duration_seconds{quantile="1"} 0
go_gc_duration_seconds_sum 0
go_gc_duration_seconds_count 0# HELP go_goroutines Number of goroutines that currently exist.# TYPE go_goroutines gauge
go_goroutines 8
Prometheus 설정 변경 → node-exporter 정보 수집
Prometheus에서 node-exporter가 수집하고 있는 메트릭을 스크래이핑
Prometheus 설정 파일을 보면 scrape_config 밑에 아래와 같이 node-exporter 관련 job이 등록 된 것을 확인 가능
static_configs 밑에 targets에서 node-exporter가 구동된 인스턴스들의 "[Node-Exporter IP]:9100"을 기록
Prometheus가 scrape_interval에 설정된 주기마다 각 인스턴스들에서 수집되는 메트릭을 스크래이핑하여 저장
$vi/etc/prometheus/prometheus.yml# my global configglobal:scrape_interval:15s# By default, scrape targets every 15 seconds.evaluation_interval:15s# By default, scrape targets every 15 seconds.external_labels:monitor:'kubernetes-monitoring'rule_files:# - 'alert.rules'# - "first.rules"# - "second.rules"# alert# alerting:# alertmanagers:# - scheme: http# static_configs:# - targets:# - "alertmanager:9093"# A scrape configuration containing exactly one endpoint to scrape:# Here it's Prometheus itself.scrape_configs:-job_name:'prometheus'scrape_interval:5sstatic_configs:-targets: ['localhost:9090']
-job_name:'node-exporter'scrape_interval:5sstatic_configs:-targets: ['[Node-Exporter IP]:9100']
Prometheus 구동
$ systemctl daemon-reload
$ systemctl restart prometheus
$ systemctl status prometheus
● prometheus.service - Prometheus Server
Loaded: loaded (/etc/systemd/system/prometheus.service; disabled; vendor preset: disabled)
Active: active (running) since Sat 2021-11-2015:10:51 KST; 23s ago
Main PID: 4020 (prometheus)
Tasks: 14Memory: 39.5M
CGroup: /system.slice/prometheus.service
└─4020 /usr/local/bin/prometheus --config.file /etc/prometheus/prometheus.yml --storage.tsdb.path /var/lib/prometheus/ --web.console.templates=/etc/prometheus/consoles --web.console.libraries=/etc/pro...
[...생략...]
Prometheus UI에서 다음 쿼리를 입력 → node-exporter 설치한 서버의 값 읽음
설정한 node-exporter란 job_name으로 수집되고 있는 인스턴스들의 개수를 확인 가능
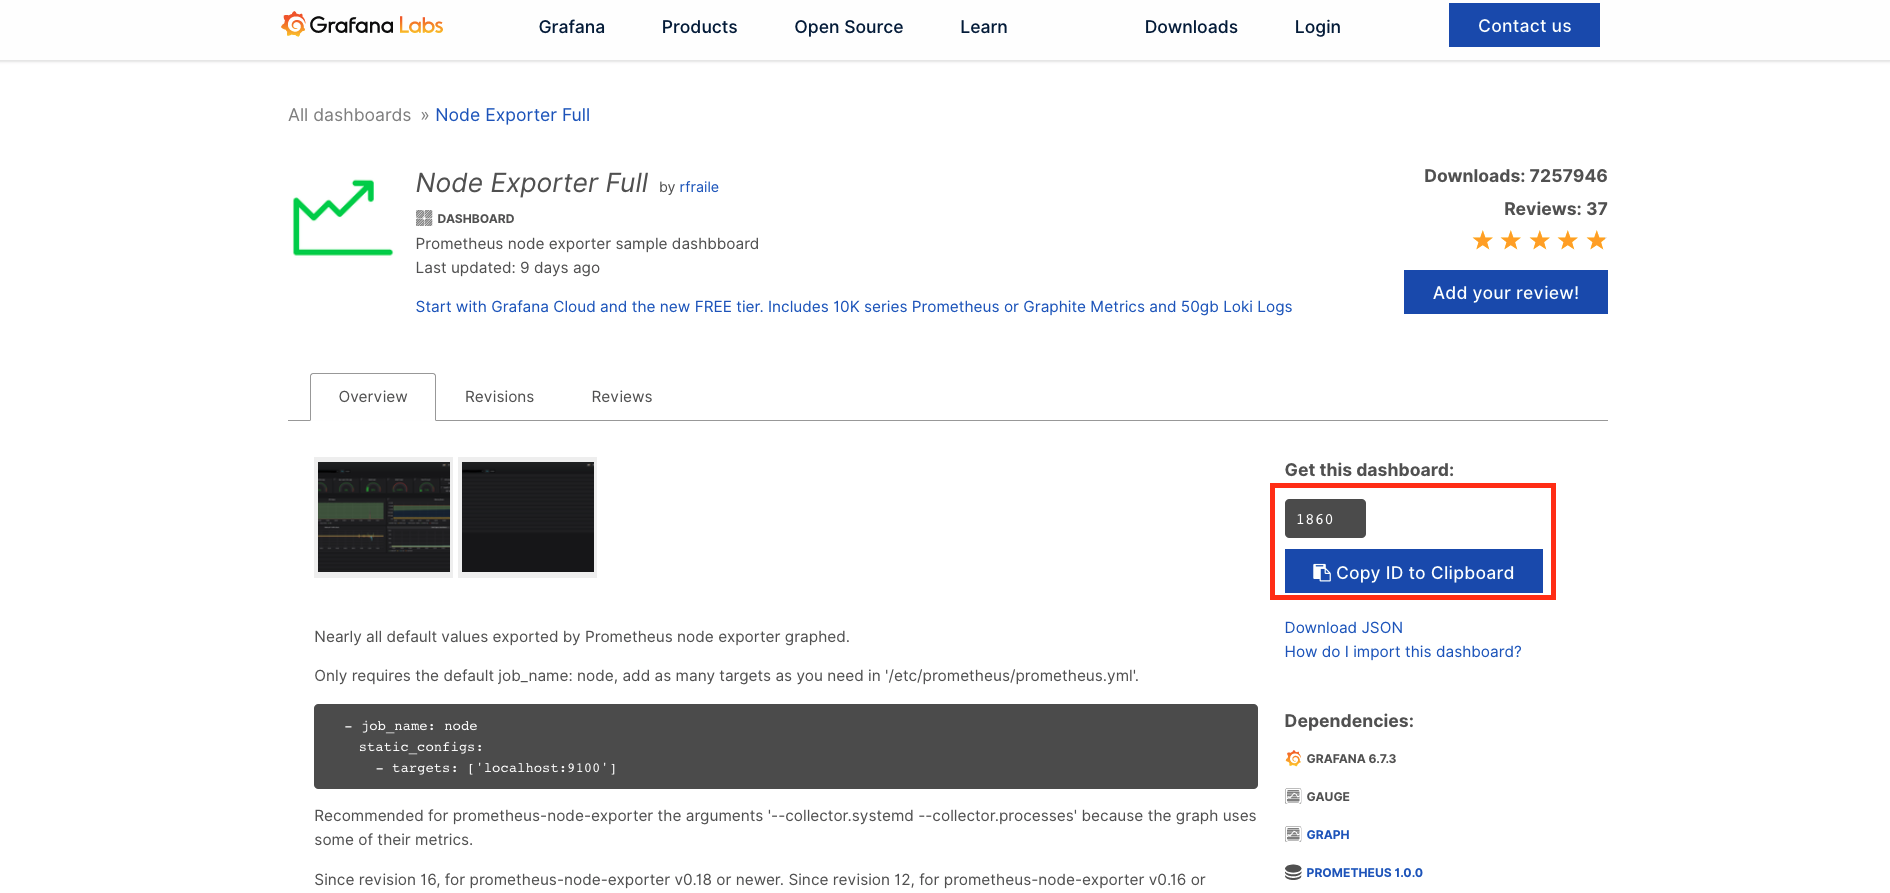
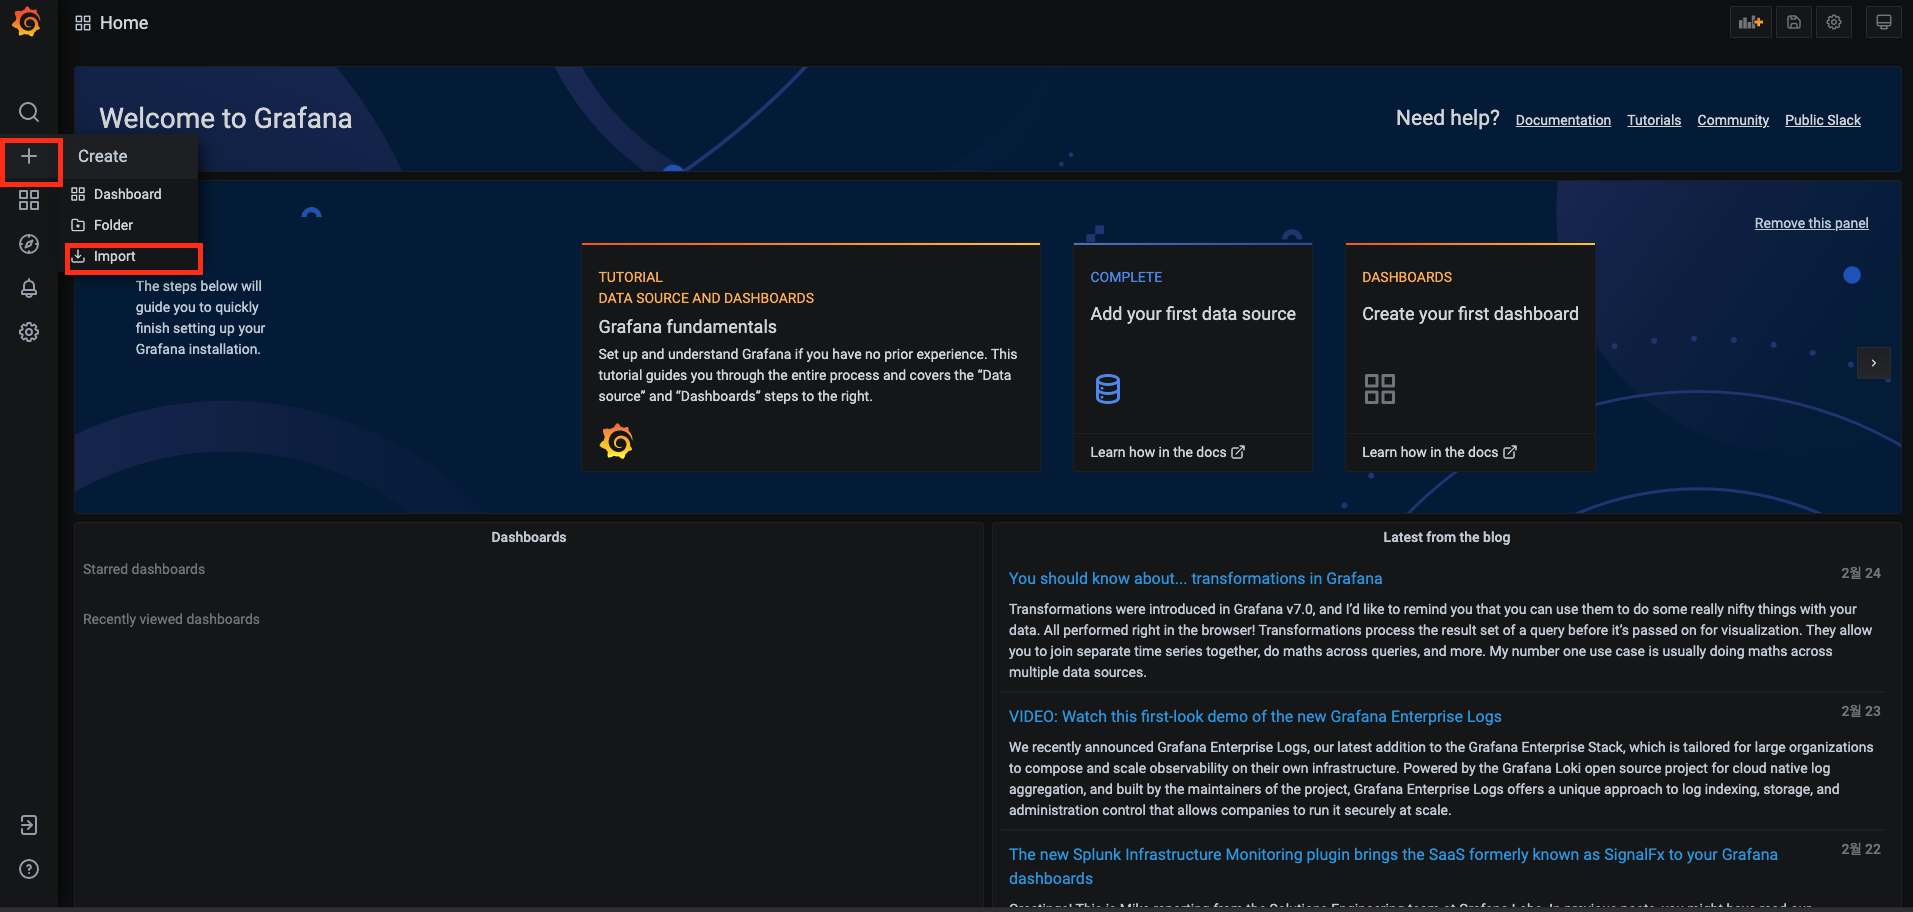
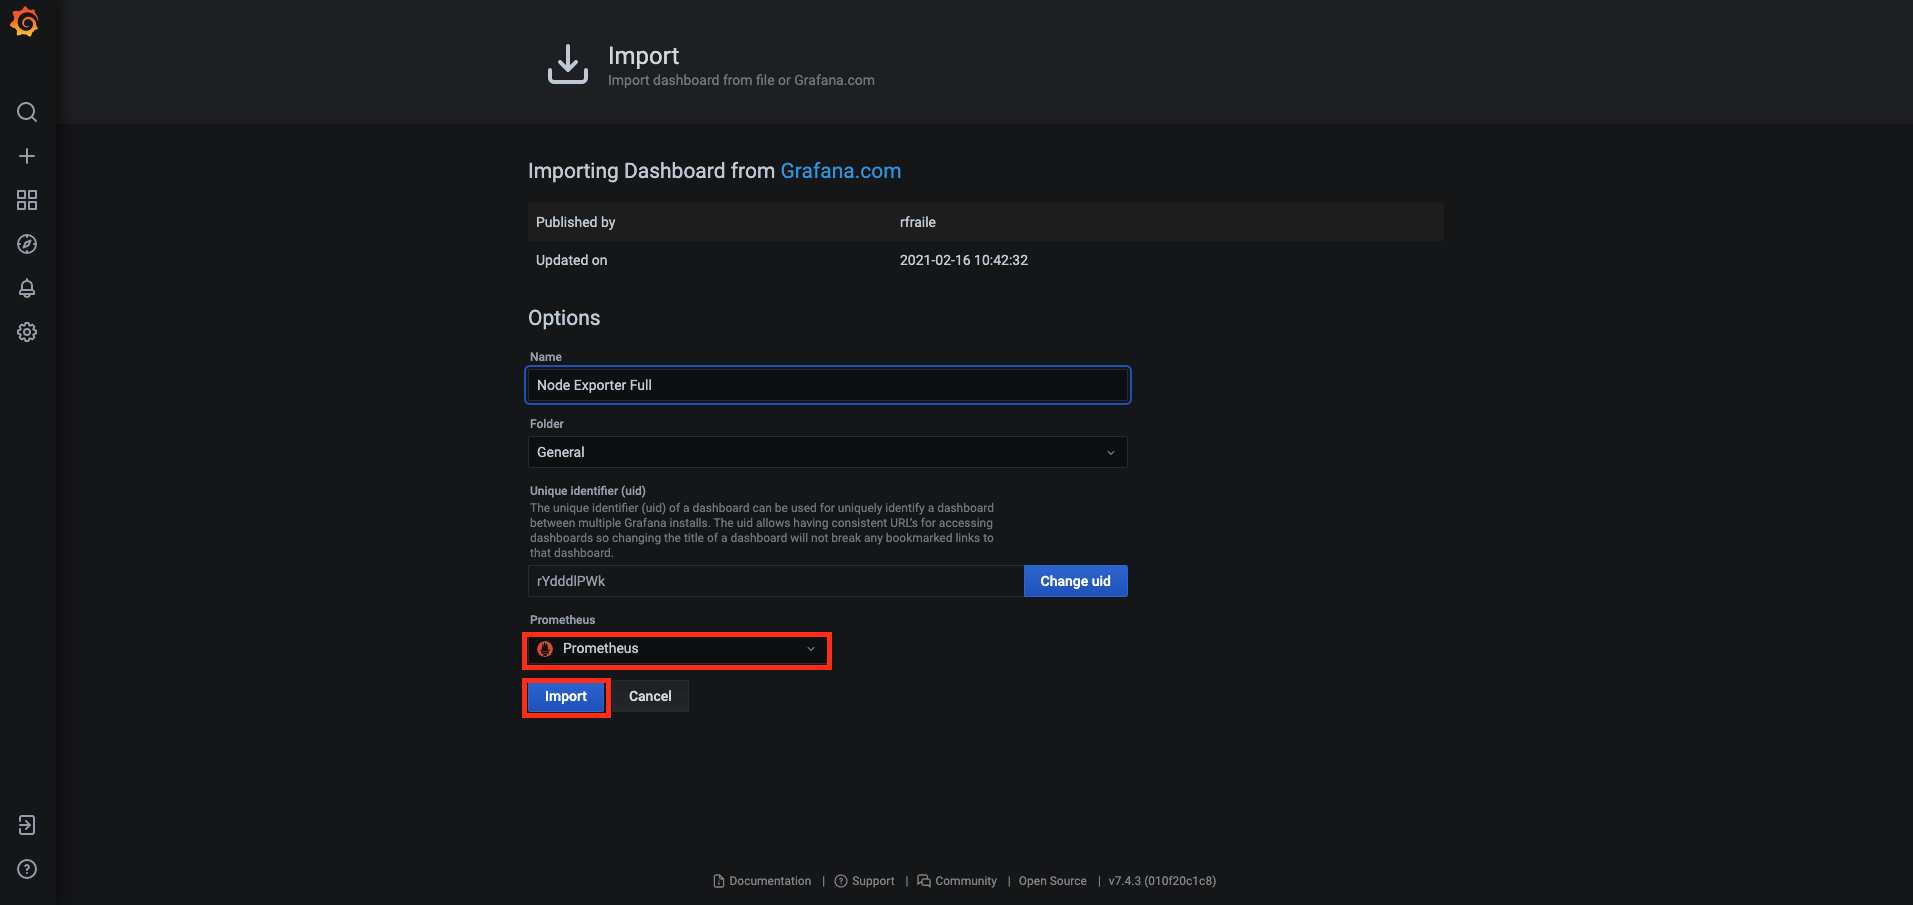
node-exporter를 모니터링하는 Grafana 대시보드 구축
기본 Grafana 에서 대시보드를 설치하는 방법은 해당 URL을 통해 학습 필요
Grafana로 대시보드를 구축할 때 좋은 점은 node-exporter같이 많이 사용하는 Exporter에 대한 대시보드가 이미 공유
$ docker ps
CONTAINER ID IMAGE COMMAND CREATED STATUS PORTS NAMES
86205a98ec4d quay.io/prometheus/prometheus:v2.33.0"/bin/prometheus --c…"14 seconds ago Up 12 seconds prometheus
4. docker로 설치한 Prometheus의 관리 스크립트 내용
4.1. Prometheus.yml 파일 수정 후 Prometheus의 yaml 파일 내용 적용
```
$ source /etc/prometheus/cmd/Restart_Prometheus.sh
# 코드 내용
#! /bin/bash
container_id=`docker ps -a | grep -i prometheus | awk -F ' ''{print $1}'`
docker restart $container_id
```
RedHat 계열의 CentOS 서버에서 Prometheus를 설치하고 systemd로 관리
Security Group, Firewall 등으로 9090번 포트에 대한 방화벽 해제가 필요
1. Prometheus 설치
설치하고 싶은 Prometheus 버전의 경로를 잘 확인하여 다운받으면 됨
systemd를 사용하지 않고 /root/apps/prometheus-2.22.0.linux-amd64/pometheus를 실행해도 Prometheus 사용 가능
$ pwd
/root
# 설치하는 컴포넌트들의 관리를 더 쉽게 하기 위해서 디렉토리 생성$ mkdir apps
# 디렉토리 이동$ cd /root/apps
# Prometheus 바이너리 파일이 들어 있는 압축 파일 설치$ wget https://github.com/prometheus/prometheus/releases/download/v2.22.0/prometheus-2.22.0.linux-amd64.tar.gz
# 설치한 Prometheus 바이너리 파일 확인$ ls
prometheus-2.22.0.linux-amd64.tar.gz
# 압축 파일 해제$ tar zxvf prometheus-2.22.0.linux-amd64.tar.gz
prometheus-2.22.0.linux-amd64/
prometheus-2.22.0.linux-amd64/NOTICE
prometheus-2.22.0.linux-amd64/prometheus
prometheus-2.22.0.linux-amd64/consoles/
prometheus-2.22.0.linux-amd64/consoles/node-cpu.html
prometheus-2.22.0.linux-amd64/consoles/prometheus-overview.html
prometheus-2.22.0.linux-amd64/consoles/node.html
prometheus-2.22.0.linux-amd64/consoles/node-overview.html
prometheus-2.22.0.linux-amd64/consoles/index.html.example
prometheus-2.22.0.linux-amd64/consoles/prometheus.html
prometheus-2.22.0.linux-amd64/consoles/node-disk.html
prometheus-2.22.0.linux-amd64/console_libraries/
prometheus-2.22.0.linux-amd64/console_libraries/prom.lib
prometheus-2.22.0.linux-amd64/console_libraries/menu.lib
prometheus-2.22.0.linux-amd64/promtool
prometheus-2.22.0.linux-amd64/LICENSE
prometheus-2.22.0.linux-amd64/prometheus.yml
2. Prometheus를 서비스로 생성하여 관리 → prometheus 실행을 systemd로 관리
Prometheus를 리눅스 systemd를 통해 서비스로 등록
$pwd
/root/apps/prometheus-2.22.0.linux-amd64
# 디렉토리 프로비저닝$ useradd --no-create-home --shell /bin/false prometheus
# 생성한 prometheus 계쩡 확인$ cat /etc/passwd | grep prometheus
prometheus:x:1001:1001::/home/prometheus:/bin/false
# prometheus를 관리할 디렉토리 생성 및 명령어 복사$ mkdir /etc/prometheus$ mkdir /var/lib/prometheus$ cp ./prometheus /usr/local/bin/$ cp ./promtool /usr/local/bin/$ cp ./prometheus.yml /etc/prometheus/$ cp -r ./consoles /etc/prometheus$ cp -r ./console_libraries /etc/prometheus
# 명령어 복사 확인$ ls /usr/local/bin/
prometheus promtool
# prometheus 관련 내용 복사$ ls /etc/prometheus
console_libraries consoles
# 유저:그룹 설정 -> prometheus 사용자 계정이 관리할 수 있도록 권한 변경$ chown prometheus:prometheus /etc/prometheus$ chown prometheus:prometheus /var/lib/prometheus$ chown prometheus:prometheus /usr/local/bin/prometheus$ chown prometheus:prometheus /usr/local/bin/promtool$ chown -R prometheus:prometheus /etc/prometheus/consoles$ chown -R prometheus:prometheus /etc/prometheus/console_libraries
# 서비스 파일 등록$ cat << EOF | tee /etc/systemd/system/prometheus.service
[Unit]
Description=Prometheus Server
Wants=network-online.target
After=network-online.target
[Service]
User=prometheus
Group=prometheus
Type=simple
ExecStart=/usr/local/bin/prometheus \
--config.file /etc/prometheus/prometheus.yml \
--storage.tsdb.path /var/lib/prometheus/ \
--web.console.templates=/etc/prometheus/consoles \
--web.console.libraries=/etc/prometheus/console_libraries
[Install]
WantedBy=multi-user.target
EOF
서비스 데몬 리로딩
$ systemctl daemon-reload
prometheus 서비스 시작
$ systemctl start prometheus
prometheus 서비스 상태 확인
$ systemctl status prometheus
● prometheus.service - Prometheus Server
Loaded: loaded (/etc/systemd/system/prometheus.service; disabled; vendor preset: disabled)
Active: active (running) since Sat 2021-11-2002:55:12 KST; 11h ago
Main PID: 11780 (prometheus)
Tasks: 14
Memory: 48.4M
CGroup: /system.slice/prometheus.service
└─11780 /usr/local/bin/prometheus --config.file /etc/prometheus/prometheus.yml --storage.tsdb.path /var/lib/prometheus/ --web.console.templates=/etc/prometheus/consoles --web.console.libraries=/etc/prometheus/console_...
Nov 2012:00:03 [서버 IP] prometheus[11780]: level=info ts=2021-11-20T03:00:03.377Z caller=head.go:889 component=tsdb msg="WAL checkpoint complete" first=2last=3 duration=29.052021ms
Nov 2012:00:03 [서버 IP] prometheus[11780]: level=info ts=2021-11-20T03:00:03.425Z caller=compact.go:440 component=tsdb msg="compact blocks" count=3 mint=1637344800000 maxt=1637366400000 ulid=01FMXMJQ5RJ914...ration=41.7039ms
Nov 2012:00:03 [서버 IP] prometheus[11780]: level=info ts=2021-11-20T03:00:03.431Z caller=db.go:1152 component=tsdb msg="Deleting obsolete block" block=01FMX6V8HX8WMN15F7H841AKH0
Nov 2012:00:03 [서버 IP] prometheus[11780]: level=info ts=2021-11-20T03:00:03.432Z caller=db.go:1152 component=tsdb msg="Deleting obsolete block" block=01FMXDPZSXA1G1VCYYE6JTVAQN
Nov 2012:00:03 [서버 IP] prometheus[11780]: level=info ts=2021-11-20T03:00:03.433Z caller=db.go:1152 component=tsdb msg="Deleting obsolete block" block=01FMWZZH9W1MH7PN1NZBT06CG9
Nov 2014:00:03 [서버 IP] prometheus[11780]: level=info ts=2021-11-20T05:00:03.321Z caller=compact.go:494 component=tsdb msg="write block" mint=1637373600000 maxt=1637380800000 ulid=01FMXVEE9X21CFW66VFRRZNAK...tion=59.826896ms
Nov 2014:00:03 [서버 IP] prometheus[11780]: level=info ts=2021-11-20T05:00:03.329Z caller=head.go:809 component=tsdb msg="Head GC completed" duration=2.347334ms
Nov 2014:00:03 [서버 IP] prometheus[11780]: level=info ts=2021-11-20T05:00:03.386Z caller=compact.go:440 component=tsdb msg="compact blocks" count=2 mint=1637344458250 maxt=1637366400000 ulid=01FMXVEEC8WEK8...tion=50.157896ms
Nov 2014:00:03 [서버 IP] prometheus[11780]: level=info ts=2021-11-20T05:00:03.393Z caller=db.go:1152 component=tsdb msg="Deleting obsolete block" block=01FMXMJQ5RJ914MKYP3J4QZ7WT
Nov 2014:00:03 [서버 IP] prometheus[11780]: level=info ts=2021-11-20T05:00:03.394Z caller=db.go:1152 component=tsdb msg="Deleting obsolete block" block=01FMWZNF1BR2H33QNDPE91K04T
Hint: Some lines were ellipsized, use -l to show in full.